Trump tariff shock eases? India’s exports to US rise after 4 months of slide; reach $6.3 billion in October


Table of Contents
ToggleTrump
tariff shock eases?
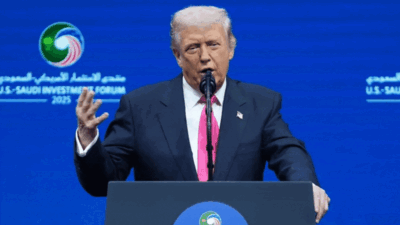
India’s exports to US rise after 4 months of slide; reach $6.3 billion in October” title=”US President Donald Trump imposed 50% tariffs on India in August, 25% of which is a penalty for India’s crude oil imports from Russia.
(AI image)” decoding=”async” fetchpriority=”high”/>
“Although October 2025 exports of $6.3 billion are 8.6% lower than the $6.9 billion recorded in October 2024, the month-on-month rise from September is a welcome improvement,” says GTRI.“Product-wise data for the USA for October are not yet available, but tariff-exempt sectors such as smartphones and pharmaceuticals may have performed better—though this remains only a tentative assumption.
Despite the October rebound, India’s shipments to the US have dropped nearly 28.4% between May and October, erasing more than $2.5 billion in monthly export value,” GTRI adds.
| Month | Export Value (US$ Bn) | Change vs Previous Month (%) | US tariffs on India Goods in addition to MFN duties |
| April | 8.4 | – | 10% |
| May | 8.8 | 4.8 | 10% |
| June | 8.3 | –5.7 | 10% |
| July | 8 | –3.6 | 10% |
| August | 6.9 | –13.8 | 10%-Aug 1-Aug 6
25%-Aug 7-Aug 26 50%-Aug 27-Aug 31 |
| September | 5.5 | –20.3 | 50% |
| October | 6.3 | 0.145 | 50% |
Source: GTRI
India’s trade data: Top Highlights
India’s aggregate exports declined 11.8% year-on-year in October, indicating widespread global demand softness.Among India’s top 20 markets, only 5 showed growth in October, with Spain (+43.4%) and China (+42.3%) showing highest increases.
Spain led primarily due to enhanced petroleum product exports, whilst China.
Hong Kong (+6.00%), Brazil (+3.54%), and Belgium (+2.22%) showed modest improvements.The remaining fifteen destinations saw drops, indicating widespread external challenges.
The United States (-8.58%) and UAE (-10.17%) showed moderate declines.
Substantial reductions occurred in Singapore (-54.85%), Australia (-52.42%), Italy (-27.66%), UK (-27.16%), and the Netherlands (-22.75%).
Additional declines were noted in Malaysia (-22.68%), Korea (-16.43%), Germany (-15.14%), France (-14.28%), Bangladesh (-14.10%), Nepal (-12.64%), South Africa (-7.54%), and Saudi Arabia (-1.12%).Imports of gold rose by 188.2% whilst silver increased by 528.7%, pushing total imports to $73.2 billion, despite gems and jewellery exports declining by 29.5%.Following May 2025’s growth of 4.8% to $8.8 billion, exports declined consistently: June showed -5.7% to $8.3 billion, July registered -3.6% to $8.0 billion, August saw -13.8% to $6.9 billion, and September experienced -20.3%, before showing signs of improvement in October.India recorded a significant increase in its merchandise imports, which reached $73.2 billion in October 2025, showing a 16.5% growth.
The rise was primarily attributed to substantial increases in precious metals buys.The country’s gold imports witnessed a remarkable increase of 188.2%, totalling $14.7 billion.
Similarly, silver imports demonstrated an exceptional growth of 528.7%, amounting to $2.7 billion compared to the previous year’s figuresThis substantial increase in precious metal imports is particularly significant as India’s gems and jewellery exports declined by 29.5% in October.
This trend suggests that the imported gold and silver are primarily serving domestic consumption rather than being utilised for export-oriented manufacturing.


